WHM Dashboard
The WSA module landing page in WHM — status tiles, quick actions, alerts, statistics.
The dashboard is the landing page of the WSA module in WHM. It gathers all real-time indicators needed to understand the module's state and launch the most common operations.
Access: WHM → Plugins → WSA – Cache for cPanel server.
💡 The dashboard is the only page designed for frequent viewing. All other pages (configuration, build, inventory) are accessible via the left sidebar.
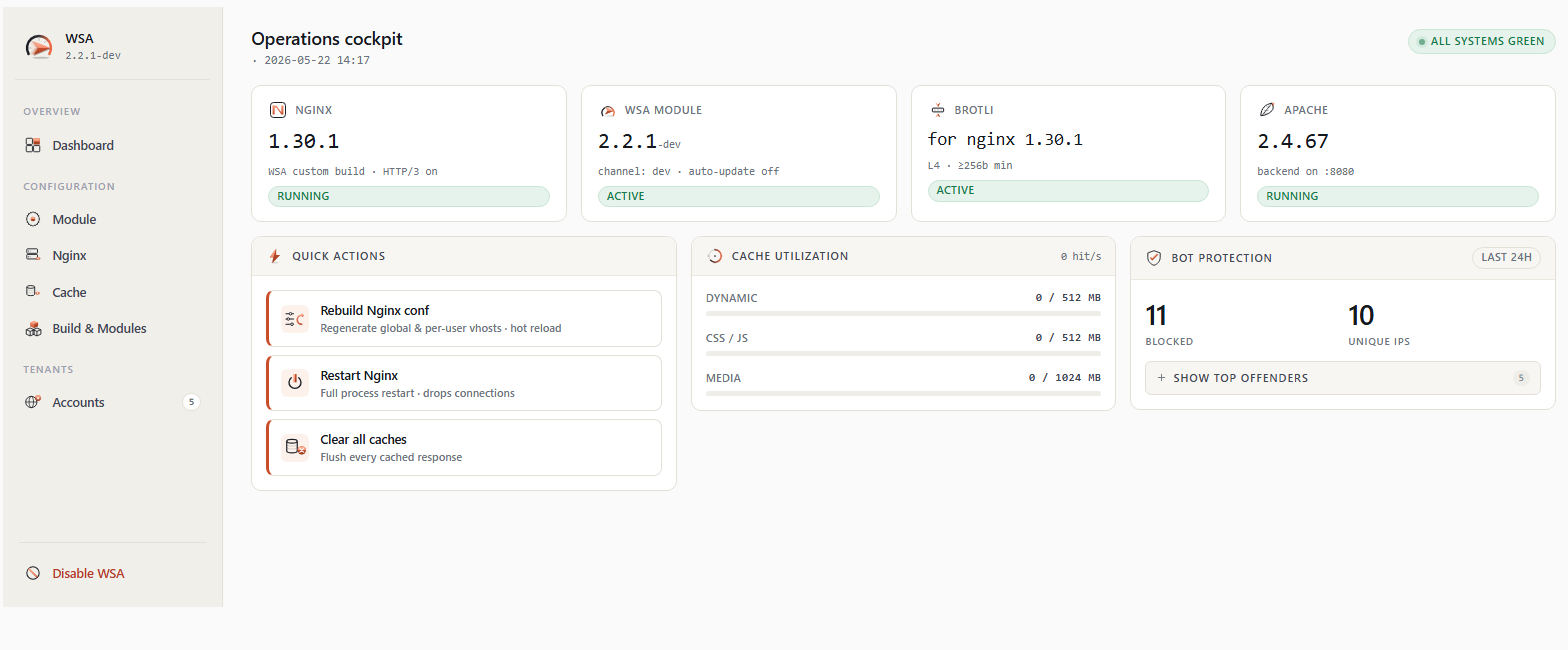
1. General layout
┌────────────────────────────────────────────────────────────────┐
│  Sidebar            │  [Global alerts — if present]            │
│  ─────────────      │  [Page alerts — if present]              │
│  📊 Dashboard       │                                          │
│  ⚙ Configuration   │  ┌──────────┬──────────┬──────────────┐  │
│  🌐 Nginx config    │  │  Status  │ Version  │   Accounts   │  │
│  💾 Cache config    │  └──────────┴──────────┴──────────────┘  │
│  🛠 Nginx build    │  ┌──────────┬──────────┬──────────────┐  │
│  📋 Inventory       │  │ Brotli   │ HTTP/3   │   Update     │  │
│  ⚠️ Disable WSA     │  └──────────┴──────────┴──────────────┘  │
│                     │                                          │
│                     │  Quick actions                           │
│                     │  ┌──────┬──────┬──────┐                  │
│                     │  │Reb.  │Rest. │Clr.  │                  │
│                     │  └──────┴──────┴──────┘                  │
│                     │                                          │
│                     │  Cache utilization     Bot protection    │
│                     │  ┌─────────────────┬─────────────────┐   │
│                     │  │ Dyn / CSS / Med │ blocked / IPs   │   │
│                     │  └─────────────────┴─────────────────┘   │
└─────────────────────┴──────────────────────────────────────────┘
2. Left sidebar
The sidebar is common to all WSA pages. It contains:
2.1 Main navigation
| Icon | Page | Description |
|---|---|---|
| 📊 | Dashboard | This page. |
| ⚙ | Module Configuration | Auto update, cache sizes, release branch. |
| 🌐 | Nginx Configuration | All exposed nginx settings (workers, timeouts, Bot Protection, rate limiting, gzip). |
| 💾 | Cache Configuration | Per-zone settings (Dynamic, CSS/JS, Media) and bypass lists. |
| 🛠 | Nginx Build & Modules | nginx binary management (RPM or WSA build), HTTP/3, Brotli. |
| 📋 | Account Inventory | List of all cPanel accounts with their cache profile. |
2.2 Account count indicator
At the bottom of the navigation list, a small indicator shows the number of active cPanel accounts detected by the module (refreshed every 5 minutes).
2.3 Disable WSA link
At the very bottom of the sidebar, a red Disable WSA link allows you to fully stop the module. Clicking opens a modal confirmation ("Are you sure you want to disable WSA?").
If validated:
- All nginx vhosts are disabled.
- Apache reclaims ports 80/443.
- The module stays installed on disk — it can be re-enabled via CLI (
/etc/wsa/wsa --enable).
⚠️ This action briefly interrupts the cache service. Sites continue to function via Apache directly, but without acceleration.
3. Alert banners
At the top of the content area, up to two types of alerts may appear:
3.1 Global alerts (all pages)
Displayed on all WSA pages, these alerts signal conditions that deserve immediate attention:
| Tone | Context | Example |
|---|---|---|
| 🔴 Danger | Blocking, urgent action required. | "The WSA HTTP/3 nginx binary was replaced by an automatic dnf update." |
| 🟡 Warning | Should be addressed soon. | "A new nginx version is available (1.30.2)." |
| 🔵 Information | For information only. | "Brotli is compiled for nginx 1.30.0, you're now using 1.30.1. Rebuild recommended." |
Each alert displays an appropriate action button (CTA): Restore HTTP/3, Rebuild Brotli, Update nginx, etc.
3.2 Page alerts
Appear only when an action has just been performed on this page. For example, after clicking Restart Nginx, a green banner confirms "Nginx restarted successfully" or a red banner describes the error if the command failed.
3.3 "X more alerts" disclosure
The first two alerts display in full view; the rest are grouped in a foldable disclosure "Show N more alerts" to avoid cluttering the view.
4. Status tiles (first row)
Three tiles give a numerical overview of the module at a glance.
4.1 Module status tile
Displays the combined nginx + Apache state:
| Displayed status | Conditions |
|---|---|
| 🟢 All systems green | nginx running, Apache running, no danger-tier alerts. |
| 🟡 Degraded | Everything running but a warning alert is present. |
| 🔴 Problem | nginx or Apache stopped, or a danger-tier alert. |
The left icon pulses gently when the status is green to signal that the check is real-time.
4.2 WSA Version tile
Displays the installed version number (e.g., 2.2.0), the release tier (stable, current, edge, dev), and an update status:
- Up to date (green pill) — No update available.
- Update available (yellow pill) with an Update WSA button — A new version is published. Click the button to launch the streamed update.
4.3 Accounts tile
Displays the total number of active cPanel accounts on the server, with a View inventory link to access the Account Inventory page.
The data is cached for 5 minutes to avoid repeated calls to the cPanel daemon.
5. Module tiles (second row)
5.1 Brotli tile
Displays the Brotli module state:
| State | Display |
|---|---|
| Active | L4 · ≥256b · serves .br (green pill). Indicates compression level (4), minimum threshold (256 bytes), and that pre-compressed .br files are served. |
| Installed, disabled | for nginx 1.30.0 · installed, disabled (neutral pill). Compiled but not enabled. |
| Rebuild recommended | (yellow pill) — Brotli was compiled for an older nginx version. |
| Not installed | not installed (red pill) — No Brotli compiled. |
A help icon (?) opens a tooltip explaining what L4, ≥256b, serves .br mean.
5.2 HTTP/3 tile
Displays the HTTP/3 build state:
- WSA custom build · 1.30.1 (brand pill) — The custom HTTP/3 binary is installed.
- Stock RPM · 1.30.0 (neutral pill) — The standard nginx binary is used.
Sub-line indicates the QUIC emission state:
- QUIC enabled — SSL vhosts emit
listen 443 quic;and theAlt-Svcheader. Visitors on recent browsers switch to HTTP/3. - QUIC disabled — The HTTP/3 binary is installed but doesn't emit QUIC (useful for testing before enabling).
5.3 WSA Module Update tile
Displays the auto-update status:
- Auto-update enabled (green pill) — The module updates daily.
- Auto-update disabled (neutral pill) — Updates are manual.
- If an update is available, an Update now button is exposed.
6. Quick actions (third row)
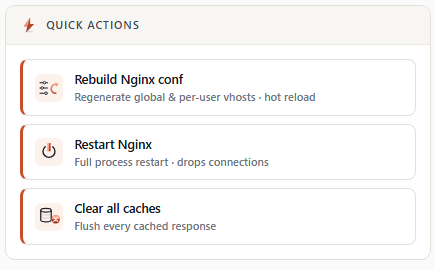
Three large action buttons for the most common operations. Each button displays an icon (24×24), a title, and a description sub-line.
6.1 Rebuild Nginx conf
   [↻] Rebuild Nginx conf
Regenerate global & per-user vhosts · hot reloadEffect: Regenerates all global and per-user nginx configurations, then performs a "hot" (graceful) reload of the nginx daemon. No interruption for visitors.
When to use:
- After manually modifying a file in
/etc/nginx/(outside WSA) and wanting to integrate the changes. - After a cPanel update that changes Apache vhost configuration.
- To refresh the configuration without restarting nginx.
Duration: A few seconds to 1 minute depending on the number of accounts. The output is live-streamed in a Process status page.
6.2 Restart Nginx
   [⊙] Restart Nginx
Full process restart · drops connectionsEffect: Stops and then fully restarts the nginx process. Currently open connections are forcibly closed.
When to use:
- To apply a major configuration change that doesn't take effect via reload (rare).
- To free memory after a period of very intensive usage.
- To diagnose strange behavior (a restart often restores a healthy state).
⚠️ Asks confirmation: "Restart nginx? Active connections will drop."
6.3 Clear all caches
   [×] Clear all caches
Flush every cached responseEffect: Fully empties the nginx cache for all server accounts. The next visit to each page generates a fresh response from Apache.
When to use:
- After a major update of a shared theme or framework.
- To free disk space urgently.
- To verify that a configuration change actually applies.
⚠️ Asks confirmation: "Flush every cached response across all domains? This cannot be undone."
The operation is atomic — cache directories are renamed instantly, recreated empty, then deleted in the background at low priority.
7. Cache utilization (fourth row, left column)
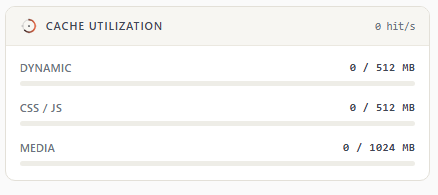
Three gauges show the current occupation of cache zones:
   ┌───────────────────────────────────────────────┐
   │ Cache utilization                  43 hit/s   │
   │                                               │
   │ Dynamic              412 / 512 MB             │
   │ ████████████████████░░░░░ 80%                 │
   │                                               │
   │ CSS / JS              98 / 512 MB             │
   │ ████░░░░░░░░░░░░░░░░░░░░░ 19%                 │
   │                                               │
   │ Media               1840 / 2048 MB            │
   │ ███████████████████████░░ 89%                 │
   └───────────────────────────────────────────────┘
7.1 The three zones
| Zone | Content | Default size |
|---|---|---|
| Dynamic | Generated PHP/HTML pages, JSON responses, APIs | 512 MB |
| CSS / JS | Stylesheets, scripts | 512 MB |
| Media | Images, fonts, videos, PDFs, downloads | 1024 MB |
Maximum sizes are configurable from the Module Configuration page.
7.2 Color code
- Blue/green (
< 90%) — Normal usage. - Yellow (
≥ 90%) — Near the limit; nginx starts evicting least-recently-used entries. - Gray (
< 5%) — Zone barely used.
7.3 hit/s counter
To the right of the title, a counter displays the hits per second rate over the last observation window. Quick indicator of the current load handled by the cache.
📝 Note 2.2.0: on servers in
induser_enable=1mode (per-user cache), total occupation is aggregated into the Dynamic zone — per-user mode doesn't separate by content type.
8. Bot protection (fourth row, right column)
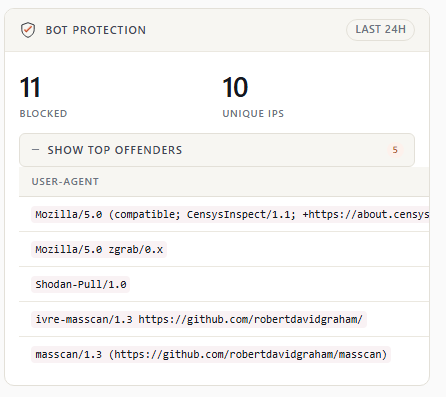
24-hour statistics on bot blocking:
   ┌───────────────────────────────────────────────┐
   │ Bot protection                   last 24h     │
   │                                               │
   │           2,847                   194         │
   │           blocked            unique IPs       │
   │                                               │
   │ [ + Show top offenders · 10 ]                 │
   └───────────────────────────────────────────────┘
8.1 Main counters
- Blocked — Total number of blocked requests (HTTP 444) over the last 24 hours.
- Unique IPs — Number of distinct IP addresses blocked.
Data comes from the /var/log/nginx/bot-block.log analyzed every 5 minutes (disk cache).
8.2 Show top offenders
A foldable disclosure reveals the list of the 10 most-blocked User-Agents over 24h, with their hit counts:
USER-AGENT                                              HITS
Mozilla/5.0 zgrab/0.x                                     4
Shodan-Pull/1.0                                           3
Mozilla/5.0 (compatible; CensysInspect/1.1; ...)          2
...
Useful for:
- Identifying new bots to add to block lists.
- Confirming current lists catch what you want.
- Spotting an ongoing targeted attack (abnormal volumes).
9. Asynchronous behavior of actions
All dashboard actions that modify server state (rebuild, restart, clear, update, disable) use the streamed output mode:
- Click the button.
- The page switches to a Process status view with a black terminal.
- The command output displays live, line by line.
- At the end, a green message (success) or red message (error) closes the streaming.
- A Back to dashboard button returns to the home page.
This approach avoids the operator staring at a spinner for 30 seconds without knowing what's happening.
10. Further reading
- Module Configuration — Auto update, cache sizes, release branch.
- Nginx Build & Modules — nginx binary management, HTTP/3 activation, Brotli compilation.
- Account Inventory — Detailed account list with bulk actions.
- Release notes 2.2.0 — Details of the changes in this interface.