Server Monitoring
CPU/load/disk/Apache/Nginx metrics with threshold alerting, SSH login tracking, and post-mortem snapshots.
Version 1.1.7 · Store extension · requires PHP 7.4+ with
sqlite3+pdo_sqliteLive SSH login tracking with email notifications, and 30-day history of CPU / load / disk / Apache workers with threshold-based alerting.
Server Monitoring is a lightweight, cron-driven (no daemon) monitoring stack with three pillars:
- Metrics — 1-minute samples of CPU / I/O wait, load average, disk usage per mount, Apache workers and Nginx connections, stored in SQLite with threshold + duration + cooldown alerting.
- SSH logins — every successful SSH authentication from
/var/log/secureis recorded and (optionally) emailed, with risk classification per source IP. - Snapshots — a wide cross-section of system state (processes, Apache scoreboard, MySQL processlist, dmesg, …) captured manually or automatically when an alert fires — a post-mortem aid even if the server later goes down.
It's also the one extension that is genuinely useful on cPanel DNSOnly nodes.
Metrics tab
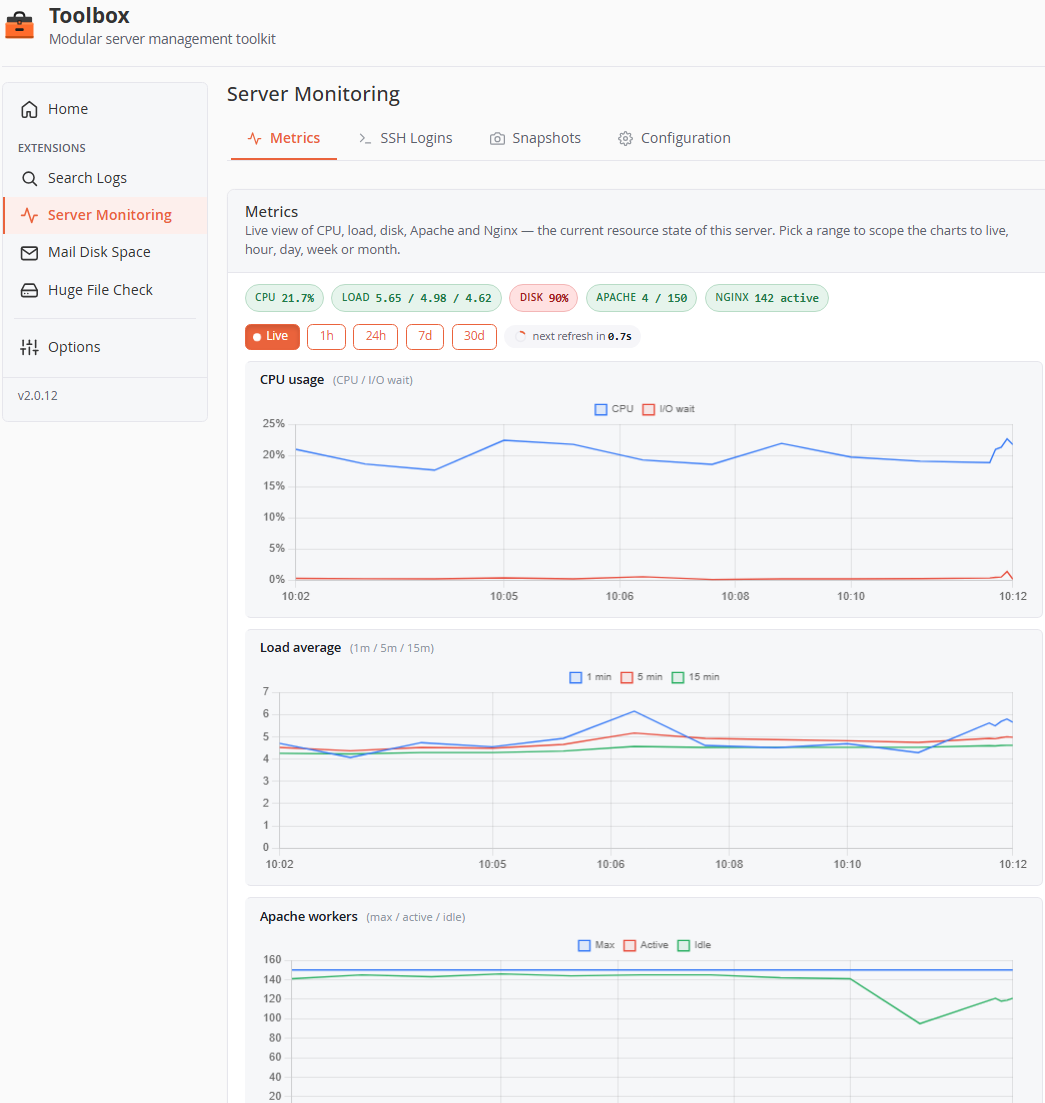
- Status chips — at-a-glance current values (CPU, Load, Disk, Apache, Nginx), tinted by proximity to their alert thresholds.
- Range selector —
Live(last 10 min, auto-refresh every 5 s with countdown),1h,24h,7d,30d. - Charts (full-resolution lines, one block per metric group):
- CPU usage — CPU % and I/O wait %.
- Load average — 1 / 5 / 15-minute.
- Apache workers — max / active / idle, plus a separate request states chart (reading, sending, keepalive, …).
- Nginx connections — active / reading / writing / waiting.
- Disk usage — one line per mount, axes pinned 0–100 %.
- Alert thresholds are drawn directly on the charts. Disabling a metric group in Configuration hides its chart and stops collecting it.
SSH Logins tab
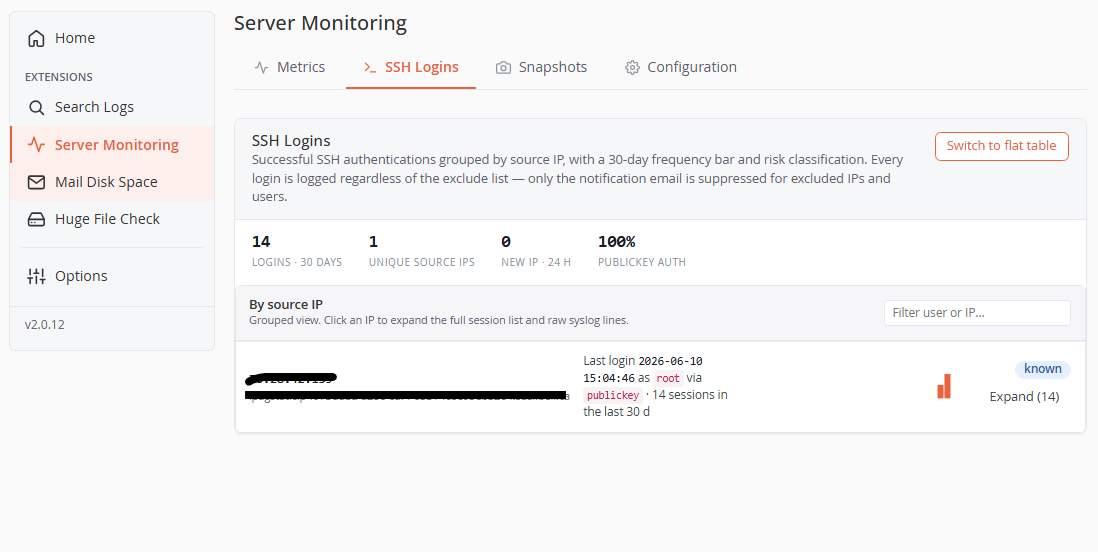
Successful SSH authentications grouped by source IP (default view), with:
- Stats row — total logins (30 d), unique source IPs, new IPs (24 h), publickey-auth percentage.
- Per-IP rows — IP + reverse-DNS hostname (resolved asynchronously), last login (user, method), a 30-day frequency bar, and a risk badge:
- New IP (red) — first seen less than 24 h ago. New IPs are also surfaced in a banner at the top with a shortcut to the exclude list.
- Trusted (green) — seen on 5+ distinct days.
- Known (blue) — everything else.
- Excluded (gray) — in the exclude list (row dimmed).
- Expand (N) — lazily loads the full session list with raw syslog lines for that IP.
- Switch to flat table — a classic filterable/paginated table (When / User / Source IP / Method / Raw syslog) if you prefer.
Every login is recorded regardless of the exclude lists — exclusion only suppresses the notification email, never the audit trail.
Snapshots tab
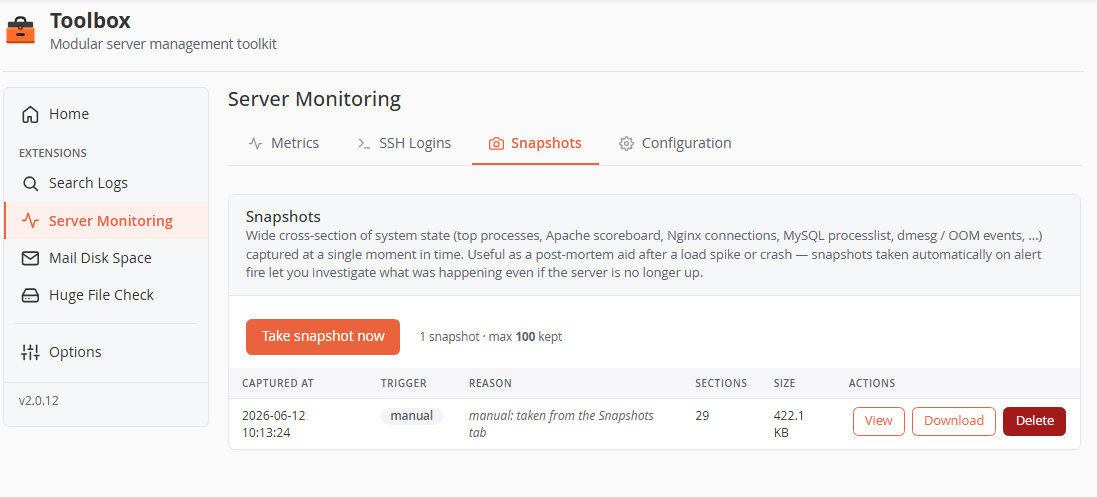
- Take snapshot now — captures on demand. Auto-snapshots fire when an alert triggers (configurable, with a cooldown so multi-metric incidents don't pile up captures).
- Each snapshot lists capture time, trigger (
manual/auto), reason (e.g.alert: cpu_pct exceeded 90%), section count and size, with View (in-browser modal), Download (ZIP) and Delete.
A snapshot captures ~29 sections across 8 groups, each command sandboxed with a 60-second timeout (a failing section never spoils the rest):
| Group | Contents |
|---|---|
| system | uptime, free -m, df -h, df -i (inodes!), vmstat 1 3, dmesg tail |
| processes | top by CPU, top by memory, full process tree |
| network | socket summary (ss -s), established connections with PIDs, top HTTP source IPs |
| apache | full mod_status HTML (per-worker detail) |
| nginx | stub_status + per-connection detail |
| mysql | processlist, status counters, InnoDB status, slow-query log tail |
| logs | messages, maillog, OOM events from dmesg, Apache/Nginx error logs |
| cpanel | service status (whmapi1), Exim queue length, journalctl errors, cPanel error log |
Retention is count-based (default 100 snapshots; oldest pruned).
Configuration tab
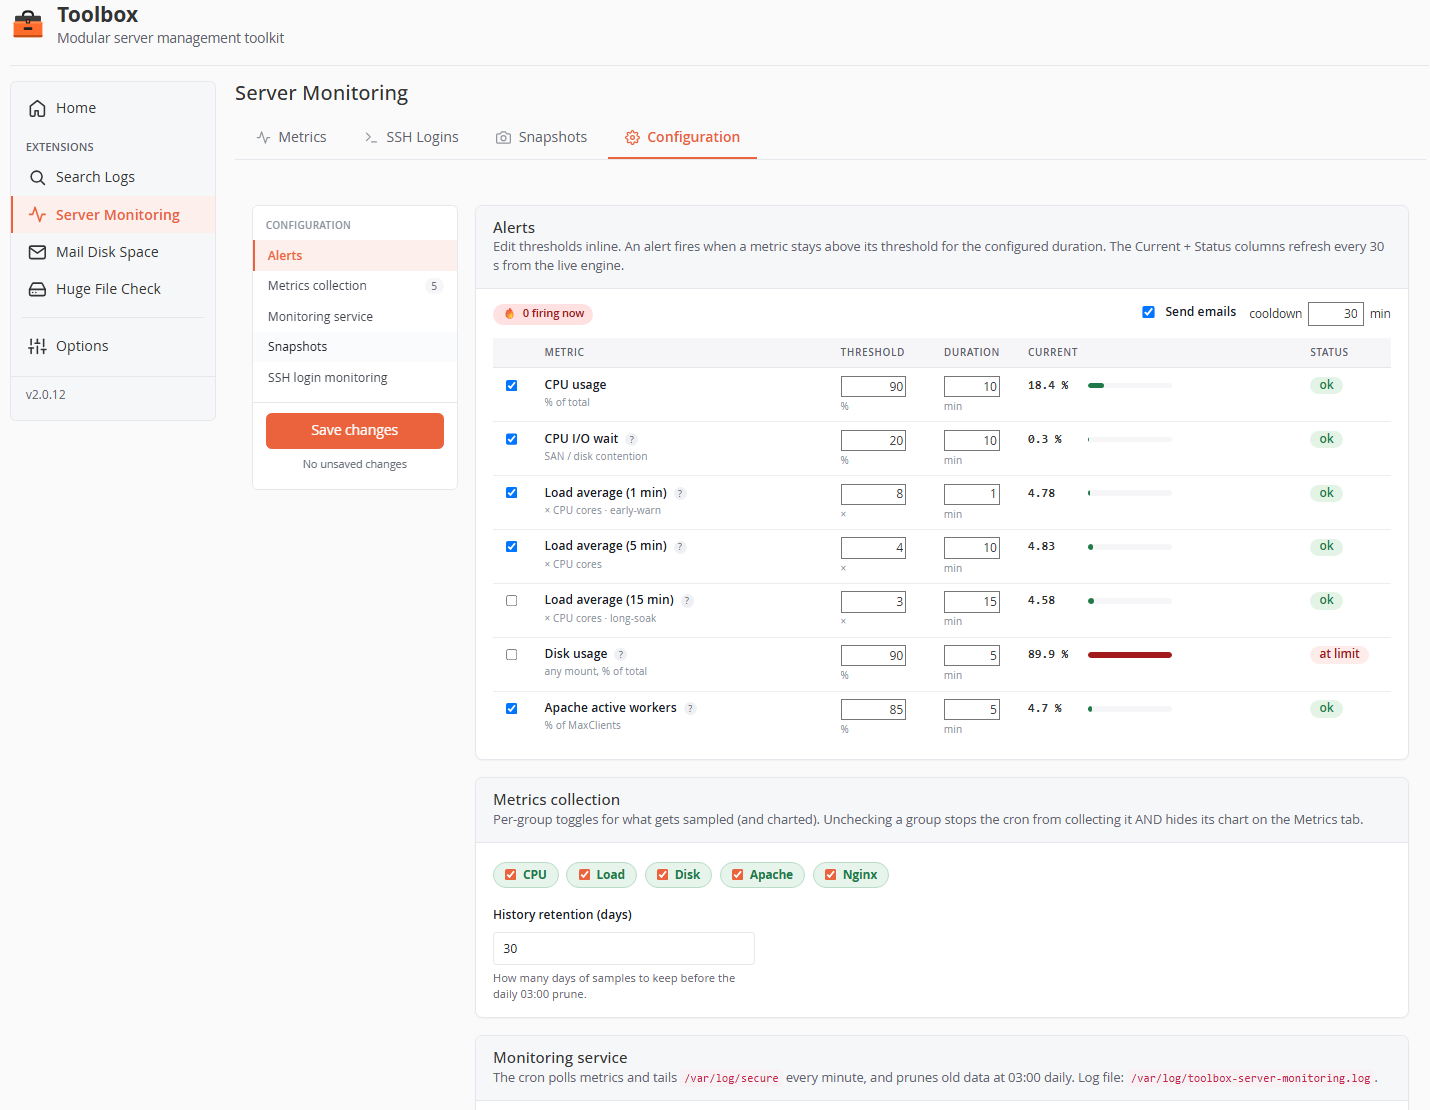
A two-column layout: section navigation with a sticky Save changes button (and an unsaved-changes counter) on the left, settings on the right.
Alerts
An alert fires when a metric stays above its threshold for the whole duration window (every consecutive sample), and recovers when it drops back — with a recovery email if the fire was notified. The Current and Status columns refresh live every 30 s.
| Metric | Default threshold | Default duration | Enabled by default |
|---|---|---|---|
| CPU usage (% of total) | 90 % | 10 min | yes |
| CPU I/O wait (%) | 20 % | 10 min | yes |
| Load average 1 min (× CPU cores) | 8× | 1 min | yes (early-warning) |
| Load average 5 min (× CPU cores) | 4× | 10 min | yes |
| Load average 15 min (× CPU cores) | 3× | 15 min | no (long-soak signal) |
| Disk usage (% per mount) | 90 % | 5 min | no (cPanel already monitors disk) |
| Apache active workers (% of MaxClients) | 85 % | 5 min | yes |
- Send emails — master switch for alert notifications (state is still tracked when off, so re-enabling is seamless).
- Cooldown (default 30 min) — minimum interval between two notifications for the same metric.
- Load thresholds are per core — they're multiplied by the CPU count at evaluation time, so one config works across heterogeneous servers.
Metrics collection
- Group toggles — CPU / Load / Disk / Apache / Nginx pills. Unchecking a group stops collecting it and hides its chart.
- History retention (days) — default 30; enforced by the daily 03:00 prune.
Monitoring service
Shows whether the cron is installed, the last tick, and an Enable cron / Disable button. The drop-in (/etc/cron.d/toolbox-server-monitoring) runs:
poll-metrics.php— every minute: collects samples (~80–200 ms wall time), evaluates alerts, dispatches notifications and auto-snapshots.tail-ssh.php— every minute: tails/var/log/securefrom a saved cursor (rotation-aware), records logins, sends notifications.prune-history.php— daily at 03:00: enforces retention; vacuums SQLite on the 1st of the month.
All three log one line per run to /var/log/toolbox-server-monitoring.log.
Snapshots
| Setting | Default |
|---|---|
| Enable snapshots (master — off disables auto and manual) | on |
| Auto-capture on alert (disk-usage alerts are skipped — a full disk doesn't need a snapshot making it fuller) | on |
| Link in alert email (deep-link to the snapshot) | on |
| Max snapshots kept | 100 |
| Min gap between auto-captures (min) | 5 |
SSH login monitoring
| Setting | Default | Notes |
|---|---|---|
| Email on every login | on | Logins are still recorded when off. |
| Sudoers only | on | Only root/wheel members are tracked; cPanel users are filtered out entirely. |
| Exclude users | empty | Comma/whitespace-separated. Excluded users still appear in the history — only the email is suppressed. |
| Exclude IPs | empty | IPv4 + IPv6, exact match (no CIDR). |
| Notification cooldown (min/user) | 10 | A user reconnecting within the window doesn't trigger a second email. |
| History retention (days) | 45 |
Notifications it sends
All through the core Notifier (see Core configuration → Notifications), priority high:
SSH login: <user>@<hostname>— host, user, source IP, auth method, time, with an "investigate immediately" prompt.<Metric> exceeded on <hostname>— metric, current value, threshold, duration; includes a link to the auto-captured snapshot when applicable.Recovered: <Metric> on <hostname>— sent when a notified alert clears.
Data & file map
| Path | Purpose |
|---|---|
extensions/server-monitoring/var/monitoring.db |
SQLite: metrics (30 d), ssh_logins (45 d), rdns_cache |
extensions/server-monitoring/var/snapshots/ |
Snapshot ZIPs (max 100) |
extensions/server-monitoring/var/*.json |
Alert state, SSH cursor, notification cooldowns, CPU sample caches |
extensions/server-monitoring/config/settings.default.json + var/settings.user.json |
Defaults + your overrides |
/etc/cron.d/toolbox-server-monitoring |
The three cron jobs |
/var/log/toolbox-server-monitoring.log |
One line per cron run (grep-friendly) |